
Search "bottleneck calculator" and the top results all work the same way: pick a CPU from a dropdown, pick a GPU, get a percentage. Nothing is measured. The calculator doesn't know your RAM is running at 2133 instead of 3600, that a launcher is chewing a core in the background, or which games you play. Two builds with identical part lists can bottleneck in opposite places.
There's also no single answer to the question. An i5-13600K with an RTX 4070 is CPU-bound in Cities: Skylines II at 1080p and GPU-bound in Cyberpunk 2077 at 1440p Ultra. Same parts. So skip the calculators and spend 15 minutes measuring, in the game that's actually giving you trouble.
> The 15-minute manual method_
Put a hardware overlay on screen. MSI Afterburner with RivaTuner is the usual pick; Intel's PresentMon works too. Show GPU load, per-core CPU load, VRAM in use and GPU temperature. Then play for 15 minutes in the spot where the game actually runs badly, not the built-in benchmark. The benchmark scene was chosen to run well.
Now read the overlay:
| GPU load 97–100% | GPU-bound. On a gaming PC this is the state you want: the part you paid the most for is the limit. Raise or lower settings to trade image quality for frames. |
| GPU load under ~90%, FPS below target | Something is starving the GPU. Usually the CPU, sometimes RAM or an FPS cap you forgot about. Check the per-core view next. |
| One CPU core pinned, others idle | Single-thread bound. Total CPU use can read 25% while the game is fully limited, so the overall percentage proves nothing. Use the per-core view. |
| VRAM within ~300 MB of full + hitching | Texture spill. Frames are fine until you turn the camera, then the game swaps textures over PCIe and hitches. Drop texture quality one notch and retest. |
| Clocks sag as temperature climbs | Thermal limit. Performance that is fine for the first 20 minutes and worse after is heat soak, and a short test will never catch it. |
> What a single check misses_
An overlay check answers what limits you in that scene, on that day. It won't tell you whether Tuesday's stutter and Friday's stutter had the same cause, and it won't catch heat soak, which needs 20+ minutes of load before it shows. Driver regressions are harder still. An 8% loss from a driver update goes unnoticed unless you have numbers from three weeks ago to compare against, and almost nobody does.
> Letting software do the watching_
CLU'D IN, the diagnostics tool built alongside the apps on this site, runs the same method continuously: PresentMon frame capture, sensor polling once a second, and a classification of the current limit into 13+ bottleneck types while you play. The session report shows the share of time each component was the limit, with the measurements charted. It's in alpha, access comes with the Patreon membership, and it's Windows only. The overlay method above is free and enough for a one-off check.
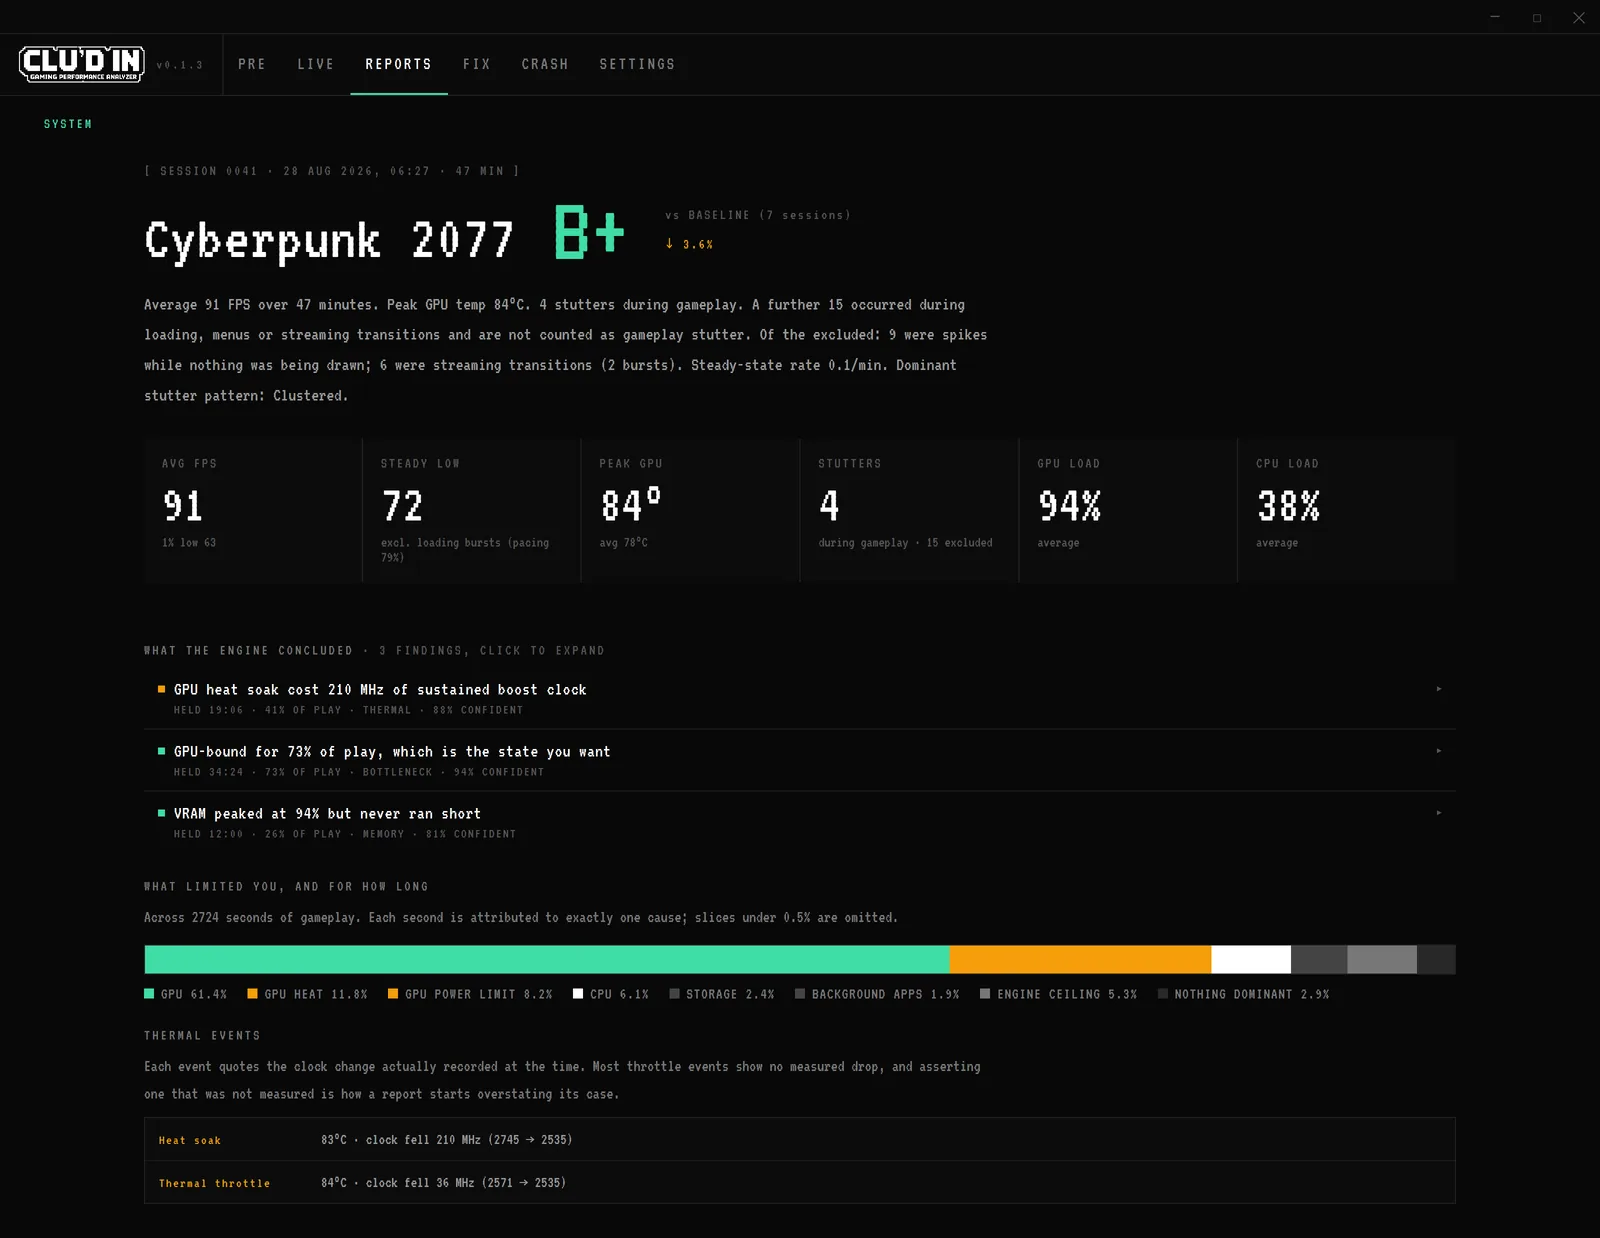
The real interface rendering a representative session with staged data.
If the symptom is stutter rather than low FPS, start with why games stutter. Crashes are their own topic: finding out why a game keeps crashing.